Create Feedback Schemes
This is a common topic for MovALyzeR, GripAlyzeR & ScriptAlyzeR. These programs will be referred to as MovAlyzeR on this page.
A feedback item allows the color coding of processed data charts of a handwriting trial, based on a certain data value, thus facilitating the visual observation of data. It is to be attached to a condition under an experiment, such that all the trials collected for that condition show the color variation.
The feedback can be based on any of the raw and processed data parameters (eg., pen pressure, vertical velocity). A maximum and minimum color can be assigned to the maximum and minimum values of the selected data parameter. All the intermediate will thus be displayed in the intermediate color spectra values of max. and min colors.
In addition, the x-y processed data chart can be displayed in real-time, which particularly is useful in observing the positional data with color-coding attached.
To create a new feedback item:
Right click on the feedback folder > create new..
o Type a three letter ID identifying the item
o Type a description
o Select the processed data feature that the color coding will be based on. For more information on the parameters, refer to the description of the processed data file, here, under time functions file.
o Choose minimum and maximum color values by double clicking on the colors. Alternatively you can use the default colors blue and red.
o Clicking ok will add the item under the feedback folder of the user.
To add an item to a condition
o Go to condition > properties > feedback > select the feedback ID from the list > click ok.
How the feedback is used...
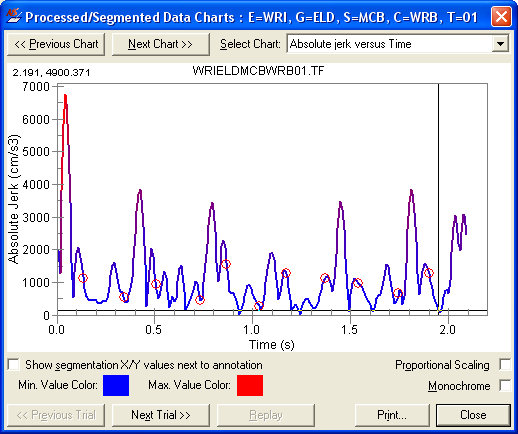
An example of the processed data chart with the above described feedback:
In the above chart, the absolute jerk values are plotted. Since the feedback is based on the absolute jerk value in our example, the minimum value is displayed in blue and the maximum values are displayed in red, and intermediate values are displayed in blends or red and blue (forming a spectrum).
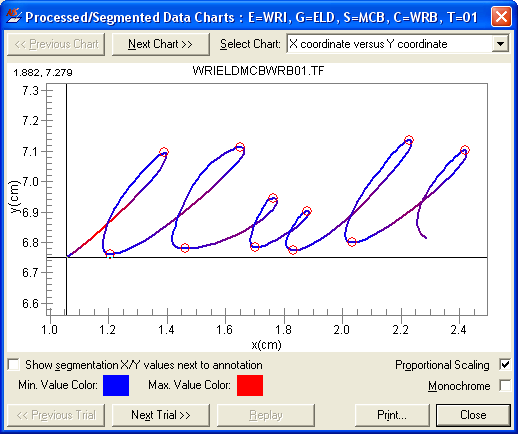
All the other processed data charts will also reflect the variation based on the absolute jerk. For example, below is the X-Y chart corresponding to the above example chart.
From the above chart, it can be noticed that the absolute jerk is high in the first stroke of this handwriting trial (due to the red shade and as the feedback scheme is based on absolute jerk).
© NeuroScript LLC. All Rights Reserved.

