| NeuroScript MovAlyzeR Help | Send comments on this topic. |
Glossary Item Box
| NeuroScript MovAlyzeR Help | Send comments on this topic. |
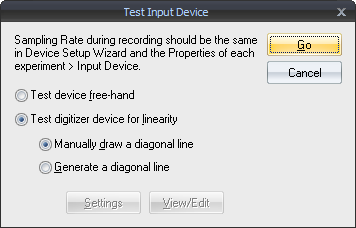
Testing Digitizer / Tablet Linearity
This is a common topic for MovAlyzeR & ScriptAlyzeR. These programs will be referred to as MovAlyzeR on this page.
Manual diagonal line
This test is available only when input device selected is tablet.
The linearity and accuracy of a pen tablet can be tested manually by generating a diagonal line with a fluent movement using a ruler. In this test, the orthogonal error, longitudinal error and number of missing samples are charted as well as logged in to the results window & log file.
Enable Logging To view the numerical results of the test, first clear the existing log file by File > Logging > Clear Log File. Then enable logging by File > Logging > Content > Select All, followed by, File > Logging > Log Actions to File.
Input device settings Main tool bar > Settings > Test/Record input device > Settings, select the option 'make recording window real size'.
Note: If you are repeating the test, and you want to look only at the newest results, do File > Logging > Clear Log File.
o Select 'Test device for linearity' > 'Manually draw a diagonal line' > GO.
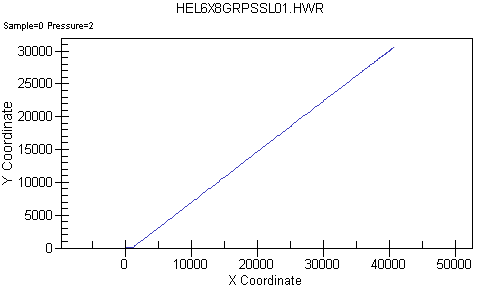
Perform Recording Using a ruler, draw a line from the 0,0 point of the recording window to the top right corner of the window. Make sure that the pen tip is kept touching straight on the tablet without much tilt. Otherwise, this could lead to linearity errors introduced manually. Also, the movement must be made as smoothly as possible, to avoid introduction of temporal errors.
The raw data plot is displayed.
Data charts: They are displayed automatically after the recording. Use the up-down arrow keys beside the Chart drop down box to see plots of the following parameters.
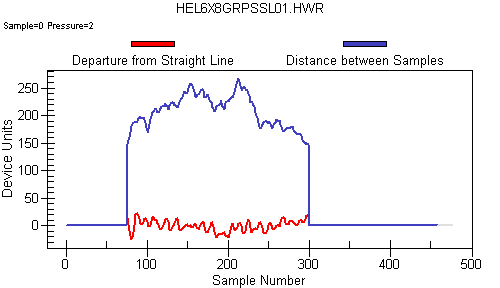
1 a. Orthogonal Error- Horizontal Spacing between successive samples (X coordinate)
1 b. Longitudinal error- Distance between samples (Y coordinate), which is also the vertical velocity per sample. Go to the chart of x Vs y > Right click > Plotting method > Points + Line. See if the samples are spaced uniformly.
Note approximately the average level of the curve (average vertical velocity).
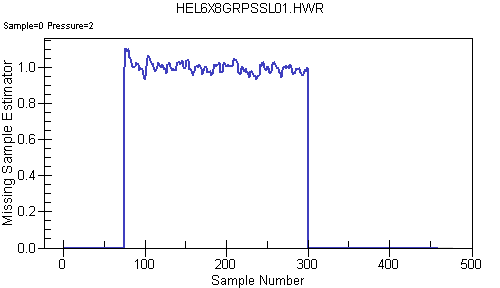
2. Number of missing samples: The number of missing samples from the tablet can be viewed with 1 sample as reference.
The chart values indicate the following:
0 to 0.58 (2 or more samples extra)
0.58 to 0.75 (1 sample extra)
0.75 to 1.5 (Perfect, 1 indicates NO samples missing)
1.5 to 2.5 (One missing sample)
2.5 to 3.5 (2 missing samples)
3.5 and above (3 or more missing samples)
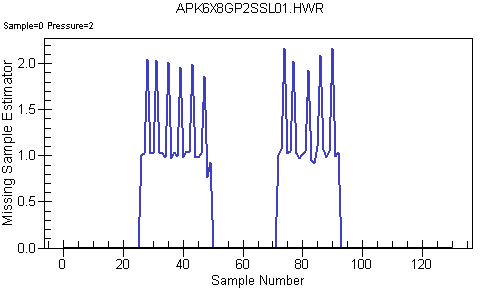
Example 1: Noisy tablet - missing samples.
The test consisted of a back and forth movement. The two movement regions above average velocity are between samples 26 - 50 and 72 - 93. Between samples 26 - 50, there are 6 cases of 1 sample missing shown by the 6 peaks. Similarly there are 5 cases of 1 missing sample in the region samples 72 - 93.
Example 2: Multiple missing samples
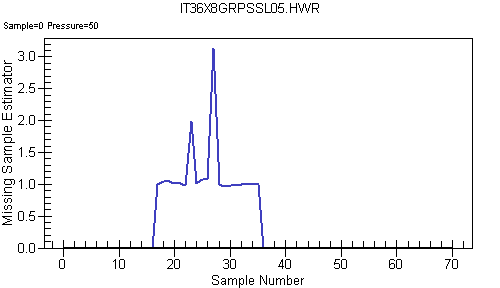
1 missing sample at sample number 23
2 missing samples at sample number 26
In all the above charts, the error values (y-axis data) are all zeros, for samples which have an absolute velocity smaller than the average absolute velocity. This is done to ensure that the calculations are performed only for the movement data and not the noise/pen-up movements.
Numerical data/View log file or Results window: The log file and results window now contain all the numerical values from the test/record input device. Log file can be viewed by File > Logging > View Log File.
o Click here for an example of the resultant log file
The relevant information from the above file are summarized below:
Linearity Test: *****DEVICE SETTINGS *****
Linearity Test: Device Resolution = 0.00508 cm
Linearity Test: Sampling Rate = 150 Hz
Linearity Test: Minimum Pen Pressure = 1
Linearity Test: |***** SAMPLES *****
Linearity Test: | # Input samples = 125.
Linearity Test: # Samples after trailing penlift removed = 107
Linearity Test: Xlength = 2013 units = 10.23 cm, Ylength = 2073 units = 10.53 cm, Absolute length = 2889.55 units = 14.68 cm.
Linearity Test: Average velocity = 27.3 units/sample = 20.8 cm/s.
Linearity Test: Consider points with velocity > 1.33 * (Avg Vel of entire movement).
Linearity Test: Segment 0: Samples 55 to 91.
Linearity Test: | ***** SPATIAL ERROR (Accuracy of the device)*****
Linearity Test: | RMS coordinate error = 2.14 units = 0.0109 cm.
Linearity Test: RMS quantization error due to the device resolution = 0.289 units = 0.00147 cm.
Linearity Test: RMS spatial error relative to quantization error = 7.43
Linearity Test: RMS coordinate error without quantization error = 2.12 units = 0.0108 cm.
Linearity Test: (If RMS coordinate error without quantization error approaches the spatial error, a better device resolution will not improve accuracy).
Linearity Test: Length of fitted line = 427 units = 2.17 cm; Straightness Error = 0.00502.
Linearity Test: Rotated counterclock (rad)= 0.775 = 88.8 degree.
Linearity Test: | ***** TEMPORAL ERROR (Missing/extra samples)*****
Linearity Test: | Total sampling irregularities = 24.3%
Linearity Test: # Samples above average velocity to be used in the linearity test = 37
Linearity Test: # Cases of 1 Samples Missing = 9
Linearity Test: # Cases of 2 Samples Missing = 0
Linearity Test: # Cases of >=3 Samples Missing = 0
Linearity Test: Total # Samples Missing = 9 = 24.3%
Linearity Test: # Cases of 1 Samples Extra = 0
Linearity Test: # Cases of 2 Samples Extra = 0
Linearity Test: # Cases of >=3 Samples Extra = 0
Linearity Test: Total # Samples Extra = 0 = 0.0%
Linearity Test: Refer to DIS file for further missing sample information.
Results (tablet)
The above test was performed two or more times, and the best result is presented for each tablet in the table below:
| Tablet | Wacom Intuos 4 | Wacom Intuos 3 | Wacom Intuos 2 | Wacom Graphire 3 | Aiptek 8000U | GTCO Calcomp CAD Pro |
| Size (W"xH") | 8"x6" | 8"x6" | 8"x6" | 8"x6" | 8"x6" | 9"x6" |
| RMS sample error (cm) | 0.00662 | 0.00914 | 0.00685 | 0.00811 | 0.0136 | 0.00827 |
| #Samples in movement range | 54 | 175 | 133 | 224 | 205 | 144 |
| Frequency of Missing Samples |
| |||||
| 1 sample missing | 0 % | 0 % | 0 % | 0 % | 25.85 % | 2.9 % |
| 2 samples missing | 0 % | 0 % | 0 % | 0 % | 0 % | 0 % |
| 3 samples missing | 0 % | 0 % | 0 % | 0 % | 0 % | 0 % |
| Frequency of Multiple Samples |
| |||||
| Double samples | 0 % | 0 % | 0 % | 0 % | 4.39 % | 2.08 % |
| Triple samples | 0 % | 0 % | 0 % | 0.04 % | 22.92 % | 0.07 % |
Real-Life testing
Aim of this test is to replicate the behavior of the tablet from within the program by data generation and simulation (using the device parameters specified and the noise value calculated from previous test)
Generate Data
First, make a note of the user root folder, where all the current user data is stored on your computer, (can be determined from files > users > click user ID > properties > settings)
1. Settings > Test/Record input device > Test device for linearity > Generate a diagonal line
2. To generate 8 circles of 1 cm diameter at 5 Hz, Click the 'settings' button > predefined = custom > fill out the following settings
a. with no noise:
Noise = 0, Device Settings => uncheck the option 'Round raw data', Start time = 0, stroke duration = 0.2, number of strokes = 16, trail time = 0, X-movement pattern (position start = 0.3, size of stroke = 1, start phase = 90, velocity = 0), Y-movement pattern (position start = 0.3, size of stroke = 1, start phase =0)
Click ok > Click 'Go' > Input the actual resolution, sampling rate and pen pressure for the tablet
3. On the test/record window click ok to display the chart. Leave the chart open.
4. Go to the user root folder in windows explorer
5. Navigate to test.hwr > open > save as EEEGGGSSSCCC01.hwr in any local folder (say 'trials')
6. Repeat steps 1. - 5. saving the files as EEEGGGSSSCCC02.hwr, EEEGGGSSSCCC03.hwr, EEEGGGSSSCCC04.hwr EEEGGGSSSCCC05.hwr and EEEGGGSSSCCC06.hwr using each of the following settings and instructions for step 2.
b. With quantization noise and no white noise
Noise = 0, Device Settings => check the option 'Round raw data', Start time = 0, stroke duration = 0.2, number of strokes = 16, trail time = 0, X-movement pattern (position start = 0.3, size of stroke = 1, start phase = 90, velocity = 0), Y-movement pattern (position start = 0.3, size of stroke = 1, start phase =0)
c. With no quantization noise and white noise = RMS noise obtained from previous test
Noise = RMS noise, Device Settings => uncheck the option 'Round raw data', Start time = 0, stroke duration = 0.2, number of strokes = 16, trail time = 0, X-movement pattern (position start = 0.3, size of stroke = 1, start phase = 90, velocity = 0.4), Y-movement pattern (position start = 0.3, size of stroke = 1, start phase =0)
d. With quantization noise and white noise = RMS noise obtained from previous test
Noise = RMS noise, Device Settings => check the option 'Round raw data', Start time = 0, stroke duration = 0.2, number of strokes = 16, trail time = 0, X-movement pattern (position start = 0.3, size of stroke = 1, start phase = 90, velocity = 0.4), Y-movement pattern (position start = 0.3, size of stroke = 1, start phase =0)
e. with no noise and one in 5 samples missing:
Noise = 0, Device Settings => uncheck the option 'Round raw data', Start time = 0, stroke duration = 0.2, number of strokes = 16, trail time = 0, X-movement pattern (position start = 0.3, size of stroke = 1, start phase = 90, velocity = 0), Y-movement pattern (position start = 0.3, size of stroke = 1, start phase =0)
On the test/record window click the button view/edit.
In the test.hwr displayed, remove 1 in every 5 samples (Click here for a procedure to automatically do this. Extract the .zip file contents, read readme file for instructions)
Save the file > close file. Click ok on the test/record window to display the generated data chart.
f. with no noise and random samples missing:
Noise = 0, Device Settings => uncheck the option 'Round raw data', Start time = 0, stroke duration = 0.2, number of strokes = 16, trail time = 0, X-movement pattern (position start = 0.3, size of stroke = 1, start phase = 90, velocity = 0), Y-movement pattern (position start = 0.3, size of stroke = 1, start phase =0)
On the test/record window click the button view/edit.
In the test.hwr displayed, remove random samples (To automatically do this, refer the procedure mentioned in the previous step)
Save the file > close file. Click ok on the test/record window to display the generated data chart.
7. Repeat steps 1. - 6. for 1 Hz frequency movement (that is, to set, stroke duration = 1 sec and x velocity = 0.4 cm/s) for the step 2. settings. Save the files with EEEGGGSSSCCC(07 to 12). hwr respectively.
Process data
1. Create an experiment EEE, with group GGG, subject SSS and condition CCC. Refer to the tutorial to create a minimum-size experiment.
2. Verify in Settings > select input device, the tablet dimensions and mapping. Refer to the section on mapping for mapping options.
3.Experiment > right click > experiment settings > processing > time functions > filter frequency, set to 7 Hz.
4. File > import > data import wizard > data type = Movalyzer, path = select the path to the 'trials' folder with all the trials > select experiment EEE, group GGG, condition CCC, and subject SSS > click finish.
5. All the 12 trials should now appear under the experiment when the left tree is expanded.
6. Right click subject SSS > Reprocess trials.
Analyse data
To summarize, the trials indicate the following:
EEEGGGSSSCCC01 - 5 Hz data with no noise
02 - b. With quantization noise and no white noise
03 - c. With no quantization noise and white noise = RMS noise obtained from previous test
04 - d. With quantization noise and white noise = RMS noise obtained from previous test
05 - e. with no noise and one in 5 samples missing
06 - f. with no noise and random samples missing
Similarly for trials 7-12 with 1 Hz data
Trial > right click > chart processed data > normalized jerk vs. time: This chart shows the effect of the above scenarios on the normalized jerk.
For example, the presence of RMS noise (introduced by the noise from tablet) might increase the jerk to a certain extent. Also the missing samples result in a huge jerk value. Thus, the comparison of the different trials yields to an understanding of the effect of linearity error and missing samples on the data, for the particular tablet under test.
IV. Results
Tablet make Wacom Wacom Aiptek GTCO Calcomp Type Graphire 3 Intuos 2 8000U CAD Pro Size (WxH") 6x8" 6x8" 6x8" - Average Normalized Jerk per trial 5 Hz 1 Hz 5 Hz 1 Hz 5 Hz 1 Hz 5 Hz 1 Hz 7.7586 7.9855 7.7586 7.9855 7.7586 7.9855 7.7586 7.9855 7.9857 10.0705 7.7510 10.0705 7.7510 10.0705 7.7510 10.0705 7.7941 102.8650 7.8230 132.6889 7.8881 223.5679 7.7950 121.8871 7.7876 104.6471 7.8203 120.6653 7.9066 208.205 7.7950 133.1956 7.7506 8.1397 7.7506 8.1397 7.7506 8.1397 8.7541 8.1397 8.7897 81.8999 8.7897 79.8216 8.7897 81.8999 8.7541 81.8999
| See Also |
NSHelp: Testing Subject (Gripper) | Discontinuity settings - Processing Time Functions
Getting Started: Testing Digitizer/Mouse
© NeuroScript LLC. All Rights Reserved.