| NeuroScript MovAlyzeR Help | Send comments on this topic. |
Glossary Item Box
| NeuroScript MovAlyzeR Help | Send comments on this topic. |
Charting Trial Data
This is a common topic for MovAlyzeR, GripAlyzeR & ScriptAlyzeR. These programs will be referred to as MovAlyzeR on this page.
* Charts
* Examples
* Graphical Button Descriptions
| Chart | How to plot | Description of the chart |
|
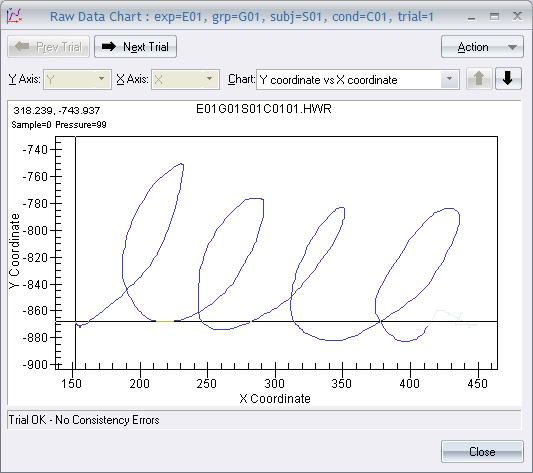
Raw data per trial |
Right click on the trial > chart data > chart raw data |
This will chart the raw position data as X versus Y (that may extend for the first 2-3 charts) Additional charts include X,Y and Z as a function of time (sampling coordinates). |
| Raw data per trial (GripAlyzeR) |
Right click on the trial > chart data > chart raw data |
The Raw Data charts display the following forces for each trial:
|
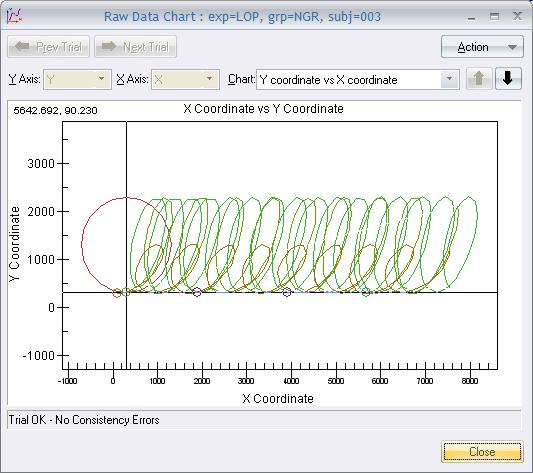
| Raw data per subject | Right-click on the subject > plot all raw data |
Shows all the raw data for a particular subject in an experiment. Note: In the case of very data intensive recordings, the time taken to display this chart is comparatively increased. |
| Raw data in real-time per trial | Right click on the trial > chart data > chart real-time data | This shows the data as it was recorded in real time by the subject. This option is useful in determining glitches during recording. |
|
Raw data in 3D per trial |
Right click on the trial > chart data > chart raw data (3D) |
This will chart the raw position data as Y versus X (that may extend for the first 2-3 charts) with Z as a third dimension Additional charts include X,Y and Z as a function of time (sampling coordinates). |
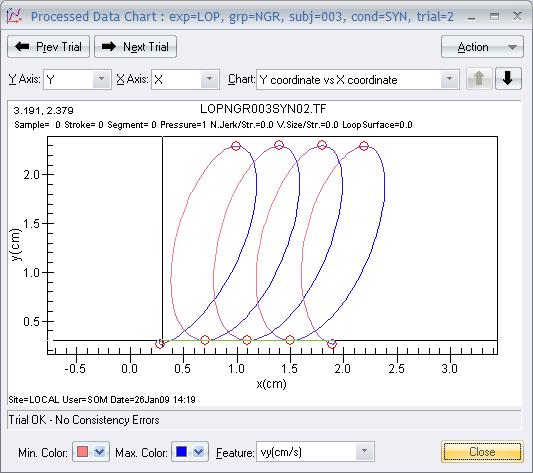
| Processed data per trial (MovAlyzeR & ScriptAlyzeR) |
Double-click a particular trial <OR> Right click on the trial > chart data > chart processed data |
Charts Time Function Data in X versus Y. Additional charts include positions, Z-coordinate, velocities, accelerations, jerks in X, Y, or absolutely. All curves are calibrated in units of cm and s. |
| Processed data per trial (GripAlyzeR) |
Double-click a particular trial <OR> Right click on the trial > chart data > chart processed data |
o Lower versus Upper Grip Forces to estimate their proportionality. |
|
Processed data in real-time per trial |
Right click on the trial > chart data > chart processed data real-time |
This shows the data as it was recorded in real time by the subject. This option is useful in determining glitches during recording. |
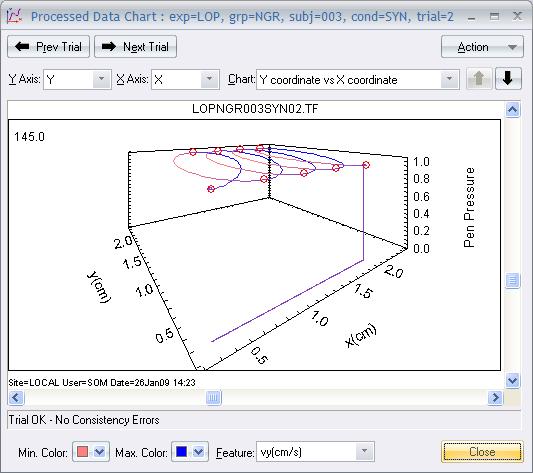
| Processed data per trial (MovAlyzeR & ScriptAlyzeR) |
Right click on the trial > chart data > chart processed data (3D) |
Charts Time Function Data in Y versus X with Z as the third dimension. Additional charts include positions, Z-coordinate, velocities, accelerations, jerks in X, Y, or absolutely. All curves are calibrated in units of cm and s. |
Click here to go to the corresponding section on help
RAW DATA CHART PER TRIAL
CHART ALL RAW DATA PER SUBJECT
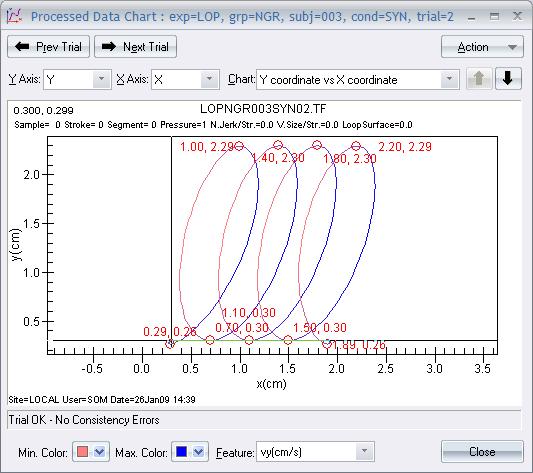
PROCESSED DATA CHART
o Stroke segmentations are marked by o.
o The submovement points are denoted by a X.
3D DATA CHART
Submovement Analysis (MovAlyzeR ONLY)
Example of a movement segmented by (o) and a submovement segmentation (x) between primary and secondary submovements if submovement analysis is enabled in the Experiment Settings.
From left to right (some buttons apply only to certain charts):
- New Chart - Opens another chart of your choosing (raw, processed, real-time, 3D)
- View Numerical Data - Display the data used to generate the chart
- Extracted Data - Display the extracted data for that trial
- Consistency Errors - Display the consistency results for that trial
- Export - Export the chart to an image, clipboard, or printer
- Print - prints the chart
- Line Thickness - Allows you to choose the line thickness for the chart
- Proportional Scaling - Choose between proportional and optimal scaling
- Monochrome - Choose between color and monochrome display
- Invert (3D only) - Inverts the Y and Z axes
- X/Y Values - Toggles the X/Y values at each segmentation point
- Segmentation Points - Toggles the display of segmentation points
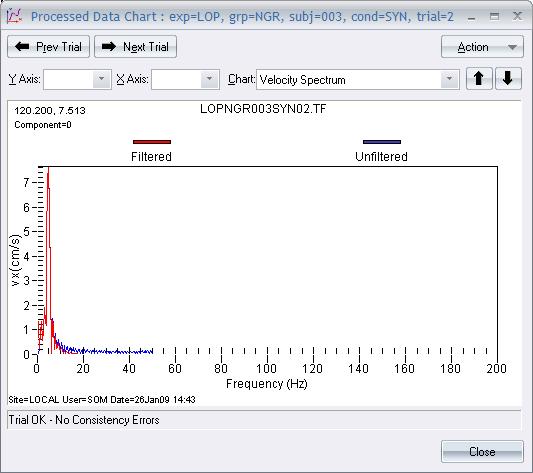
o The vertical axis is calibrated in terms of velocity. This yields a balanced spectrum between low and high frequency components.
o The height of this spectrum at a certain frequency corresponds to the average, absolute velocity observed for that frequency.
| See Also |
NSHelp: Analysis Charts | Chart Properties and Export
© NeuroScript LLC. All Rights Reserved.